Did you know that there is a correlation between the number of people who drowned after falling out of a fishing boat and the marriage rate in Kentucky? There is also a correlation between the per capita consumption of mozzarella cheese and the number of civil engineering doctorates awarded[1]. Of course, just by reading these we know that these are spurious correlations. They are good for a laugh. What happens, however, when things aren’t quite so obvious? On May eighth of 2016, Last Week Tonight with John Oliver took a humorous look at how the media frequently misrepresents or misinterprets scientific data[2]. We have all seen such reports on the evening news; a glass of red wine is the equivalent of an hour at the gym; coffee reduces your risk of cancer; coffee increases your risk of cancer. Worse than simply following bad advice, the real harm is that people can lose their confidence in science, as Oliver points out. This got me to thinking about Business Intelligence (BI) and data science.
In my post, Is Business Intelligence a Dodo Bird, I noted that BI systems need to evolve to the point where the users can interact with the data, meaning that users are empowered to navigate through the data so that they can do their jobs more effectively. This is the essence of data democratization, giving individual business users access to data and analytical tools. Of course, as I had described in my post on The Rise of Citizen Data Scientists, in order for this democratization to deliver on its promised benefits the users themselves need to evolve. Users must become literate, transliterate. Let me explain…
In order to understand when a correlation is spurious or to look more deeply into the validity of conclusions drawn from one study or another, the consumer of that data needs to be data literate. Data literacy is the ability to transform data into information. This transformation process provides context to raw data elements to give them meaning. For example; raw sales figures are data. Putting them in the context of past sales for a similar period or in comparison to a competitor provides meaning to the data. We should also note that data need not be simply numbers, data can be unstructured data such as customer reviews or product images. What is significant about data literacy, however, is that the data literate understands “what data mean, including how to read graphs and charts appropriately, draw correct conclusions from data, and recognize when data are being used in misleading or inappropriate ways”[3].
Unfortunately, simple data literacy is not enough. As Marshall McLuhan told us so many years ago, the medium is the message. What McLuhan was trying to tell us is that the media delivering a message has a greater impact on society than any message delivered through that media. Think of this for a moment. As we moved from telling stories around a fire in a cave to written text read silently to oneself, how culture passed from one generation to the next inherently changed. The Internet and email have profoundly transformed how we communicate with one another. Just look at how social media influenced the 2016 presidential election. No one message through social media had as large an impact as social media itself.
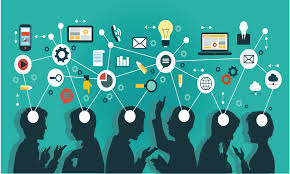
Now, let’s apply this thought to BI and data science. Ten to fifteen years ago, how a CEO or CFO understood the health of their business was significantly different than today. They had no BI tools or analytics. Neither is the business world static. There will be new tools and technologies beyond IoT (Internet of Things), Big Data, and the cloud. To invoke the old cliché, the only thing constant is change. Therefore, simple data literacy is not enough. Business users must strive to become transliterate. To be transliterate means the “ability to use diverse analog and digital technologies, techniques, modes, and protocols to search for and work with a variety of resources; to collaborate and participate in social networks; and to communicate meanings and new knowledge by using different tones, genres, modalities, and media. Transliteracy consists of skills, knowledge, thinking, and acting, which enable fluid ‘movement across’ in a way that is defined by situational, social, cultural, and technological contexts”.[4] The image below depicts the skills necessary for transliteracy. What is key here is the ability to use diverse analog and digital technologies, techniques, modes, and protocols. The Transliterate is not bound by any one media or set of technologies but is able to work across various sources of information, adapting to new technologies and methodologies are introduced.
 [5]
[5]
As we look into the future, we can be certain that the sources of data will increase which in turn increase the variety and volume of data. We also see that users who are more comfortable and adept with technology will drive greater data democratization. To avoid the pitfalls described above as well as deliver on the benefits of democratization, users must transcend mere data literacy striving for transliteracy which is not bound by any particular media or technologies.
[2] Scientific Studies: Last Week Tonight with John Oliver
[3] Carlson, J. R.; Fosmire, M.; Miller, C.; Sapp Nelson, M. (2011). “Determining Data Information Literacy Needs: A Study of Students and Research Faculty”. Libraries Faculty and Staff Scholarship and Research. 23.
[4] Sukovic, Suzana. “Transliteracy in Complex Information Environments – 1st Edition, p.8”. www.elsevier.com. Retrieved 2017-03-06.
[5] By Suzana3 – Own work, CC BY-SA 4.0, https://commons.wikimedia.org/w/index.php?curid=59207442

Pingback: The Data Science Process | Meditations on BI and Data Science
This article frames simply and clearly an important shift to data literacy. As data literacy and analytics are becoming increasingly more relevant in many sectors, it is very important to think more dynamically and flexibly about skills sets.
LikeLiked by 1 person
Pingback: Project Management Dashboard | Meditations on BI and Data Science
Pingback: Big Data Dashboard Design – a Challenge | Meditations on BI and Data Science
I think this is among the most vital info for me. And i am glad reading your article.
But wanna remark on some general things, The web site style is great, the articles is really nice : D.
Good job, cheers
LikeLike